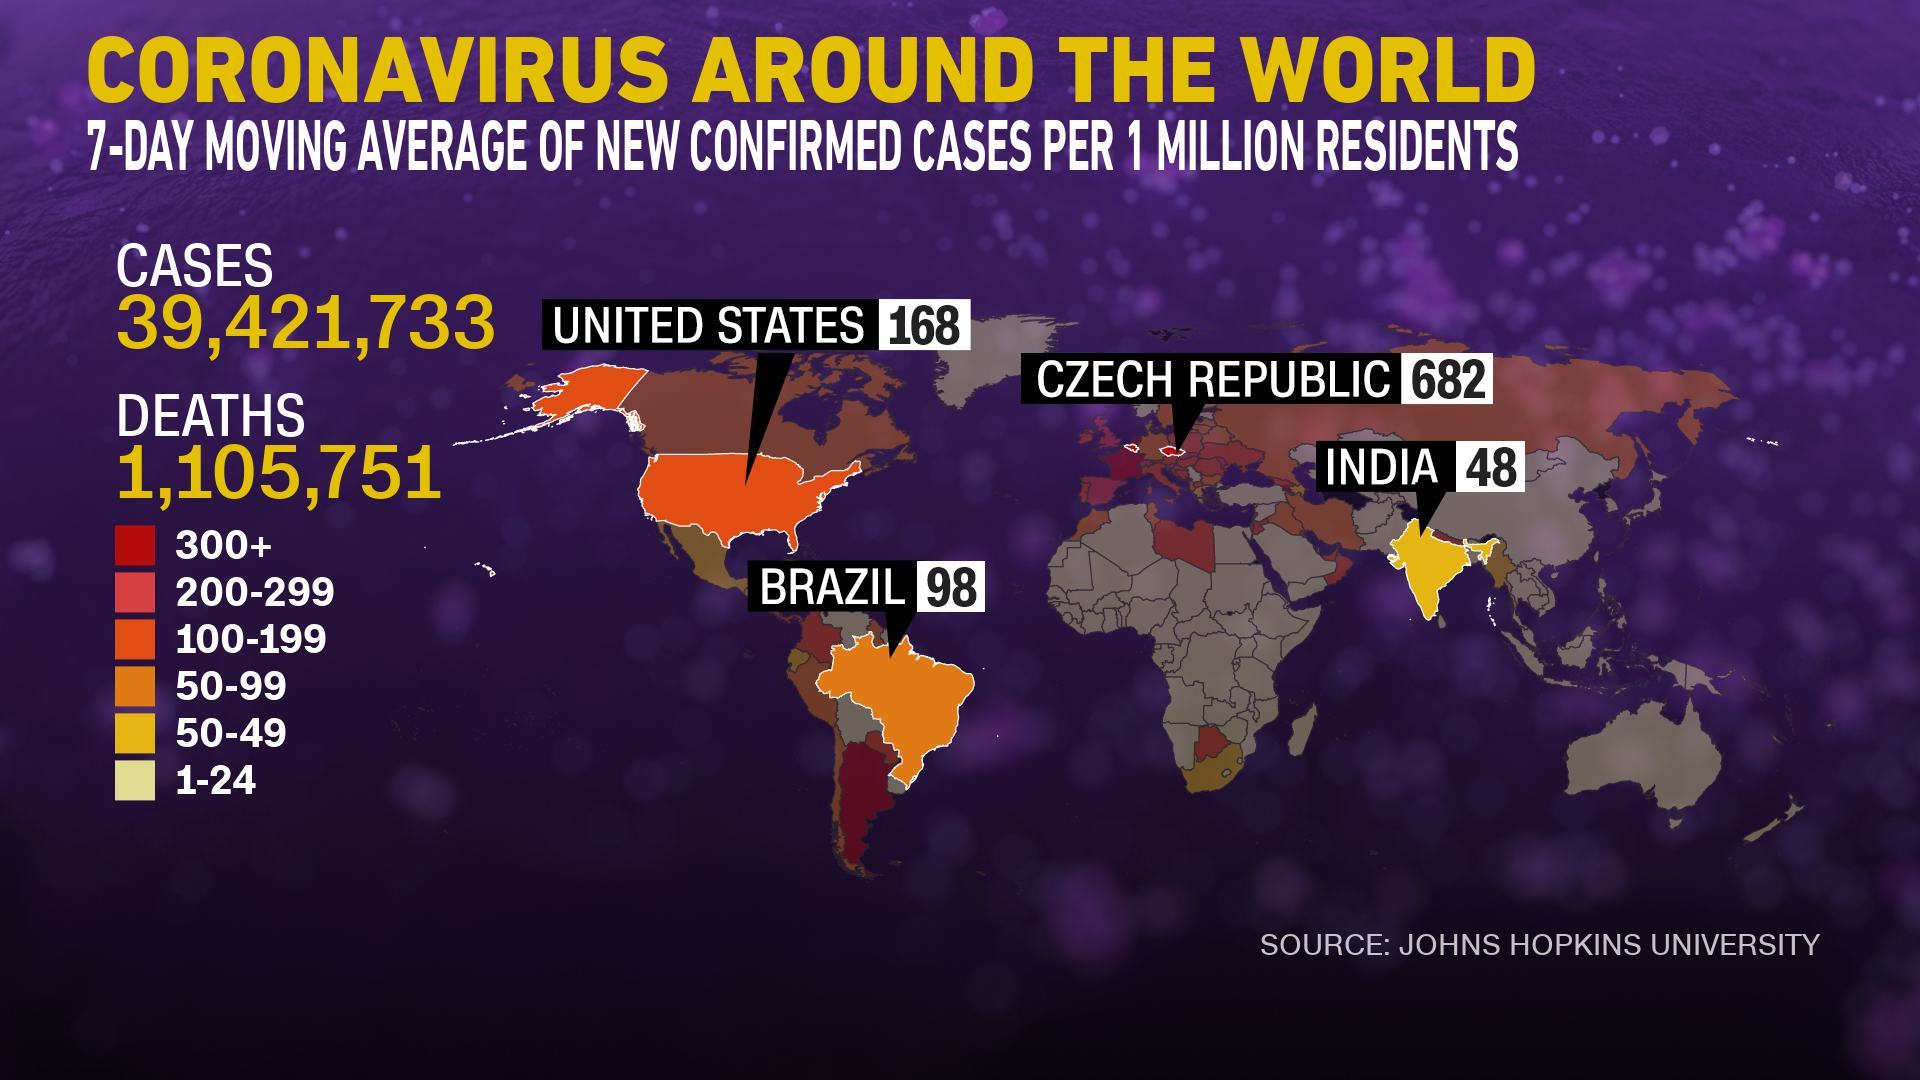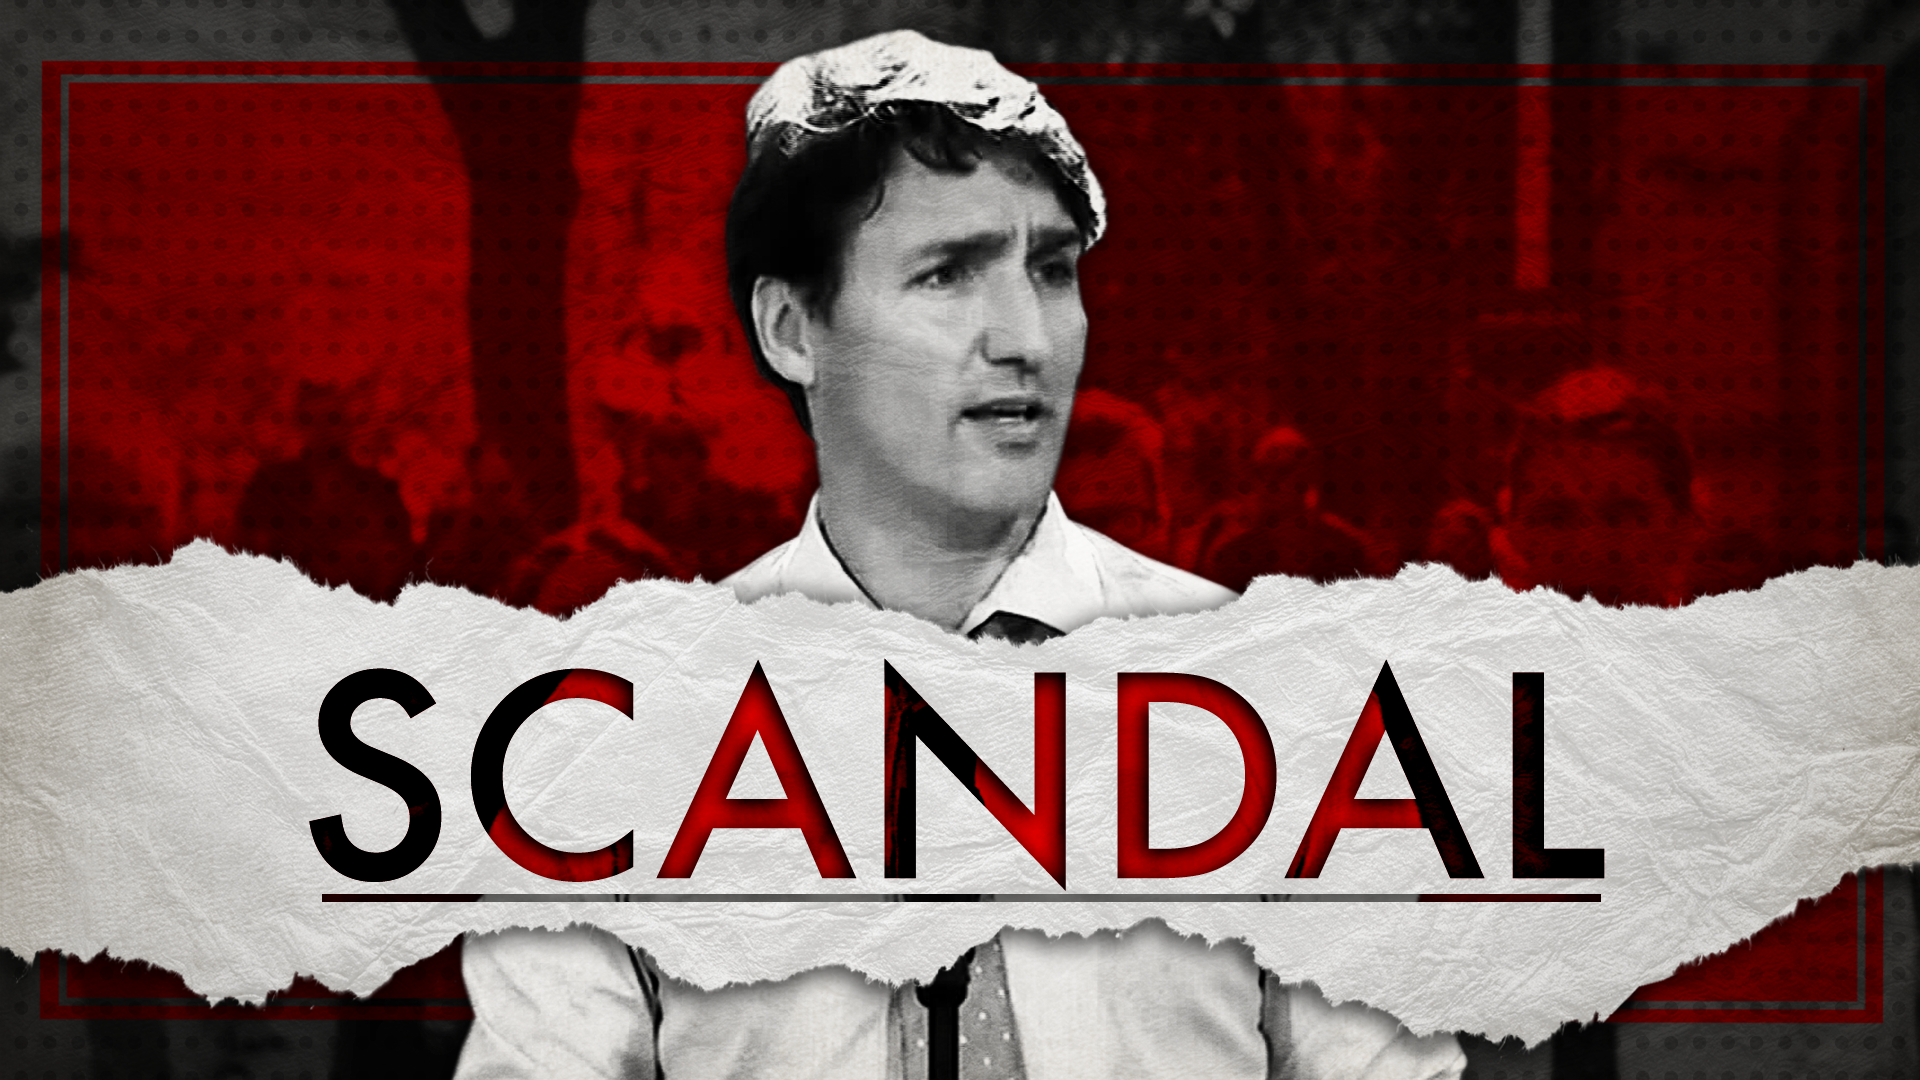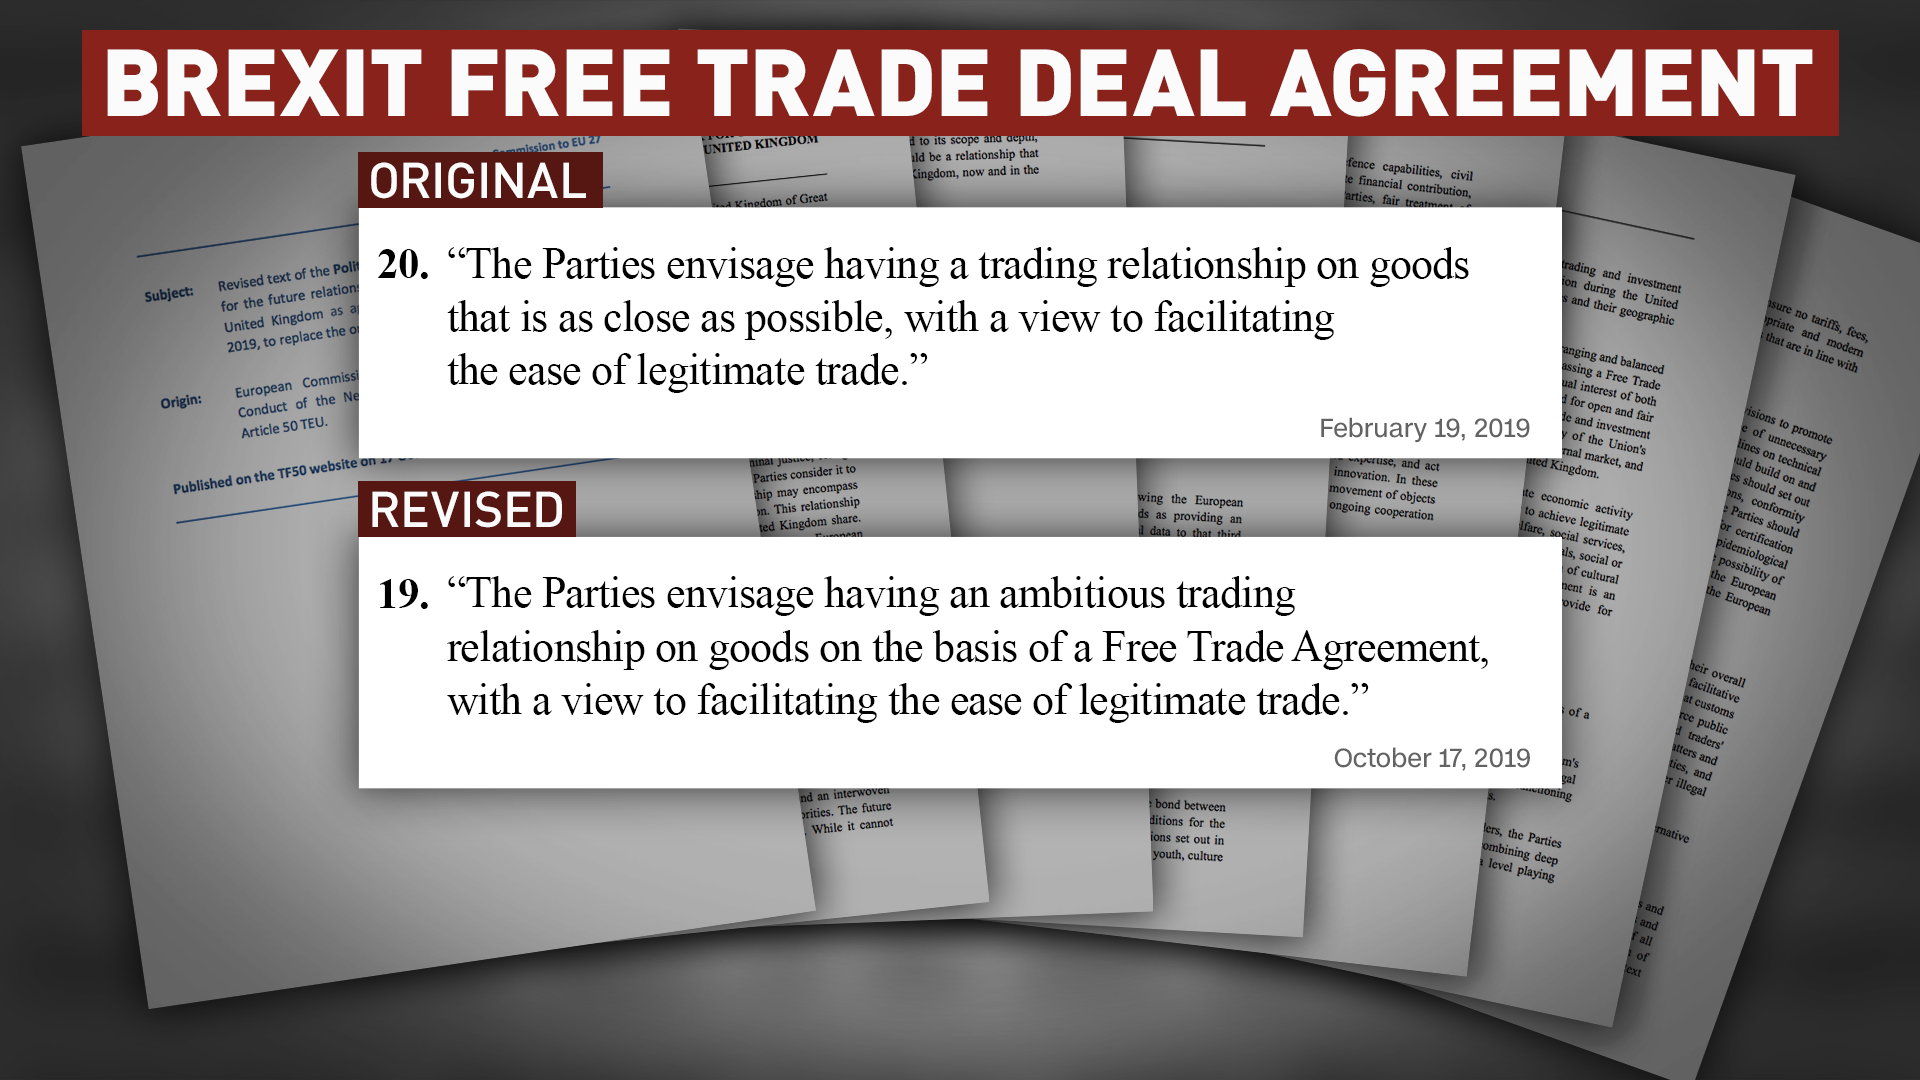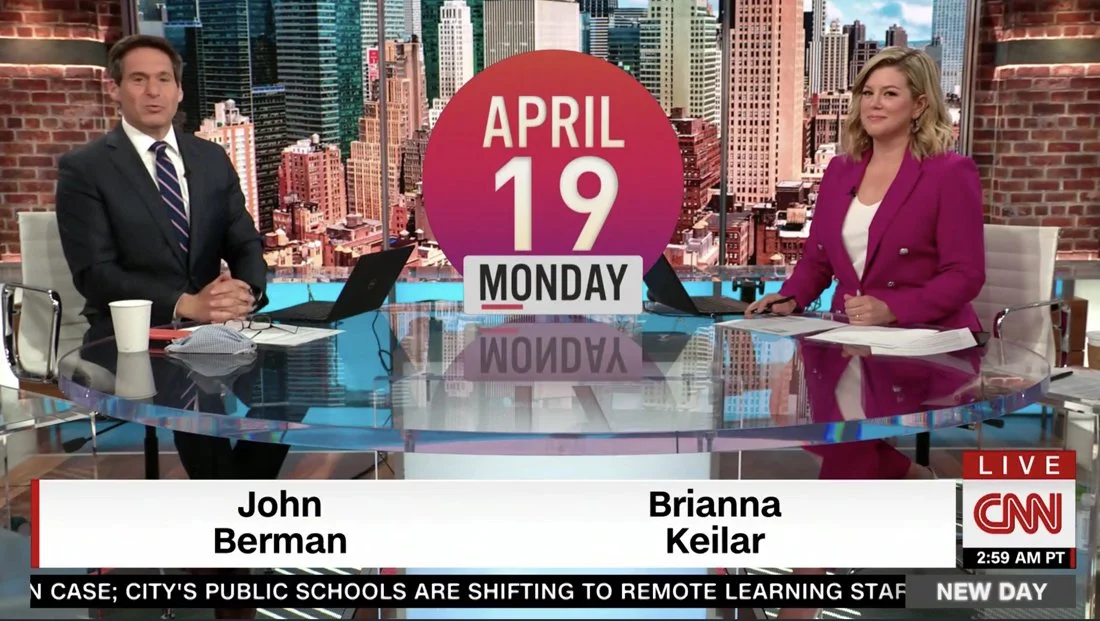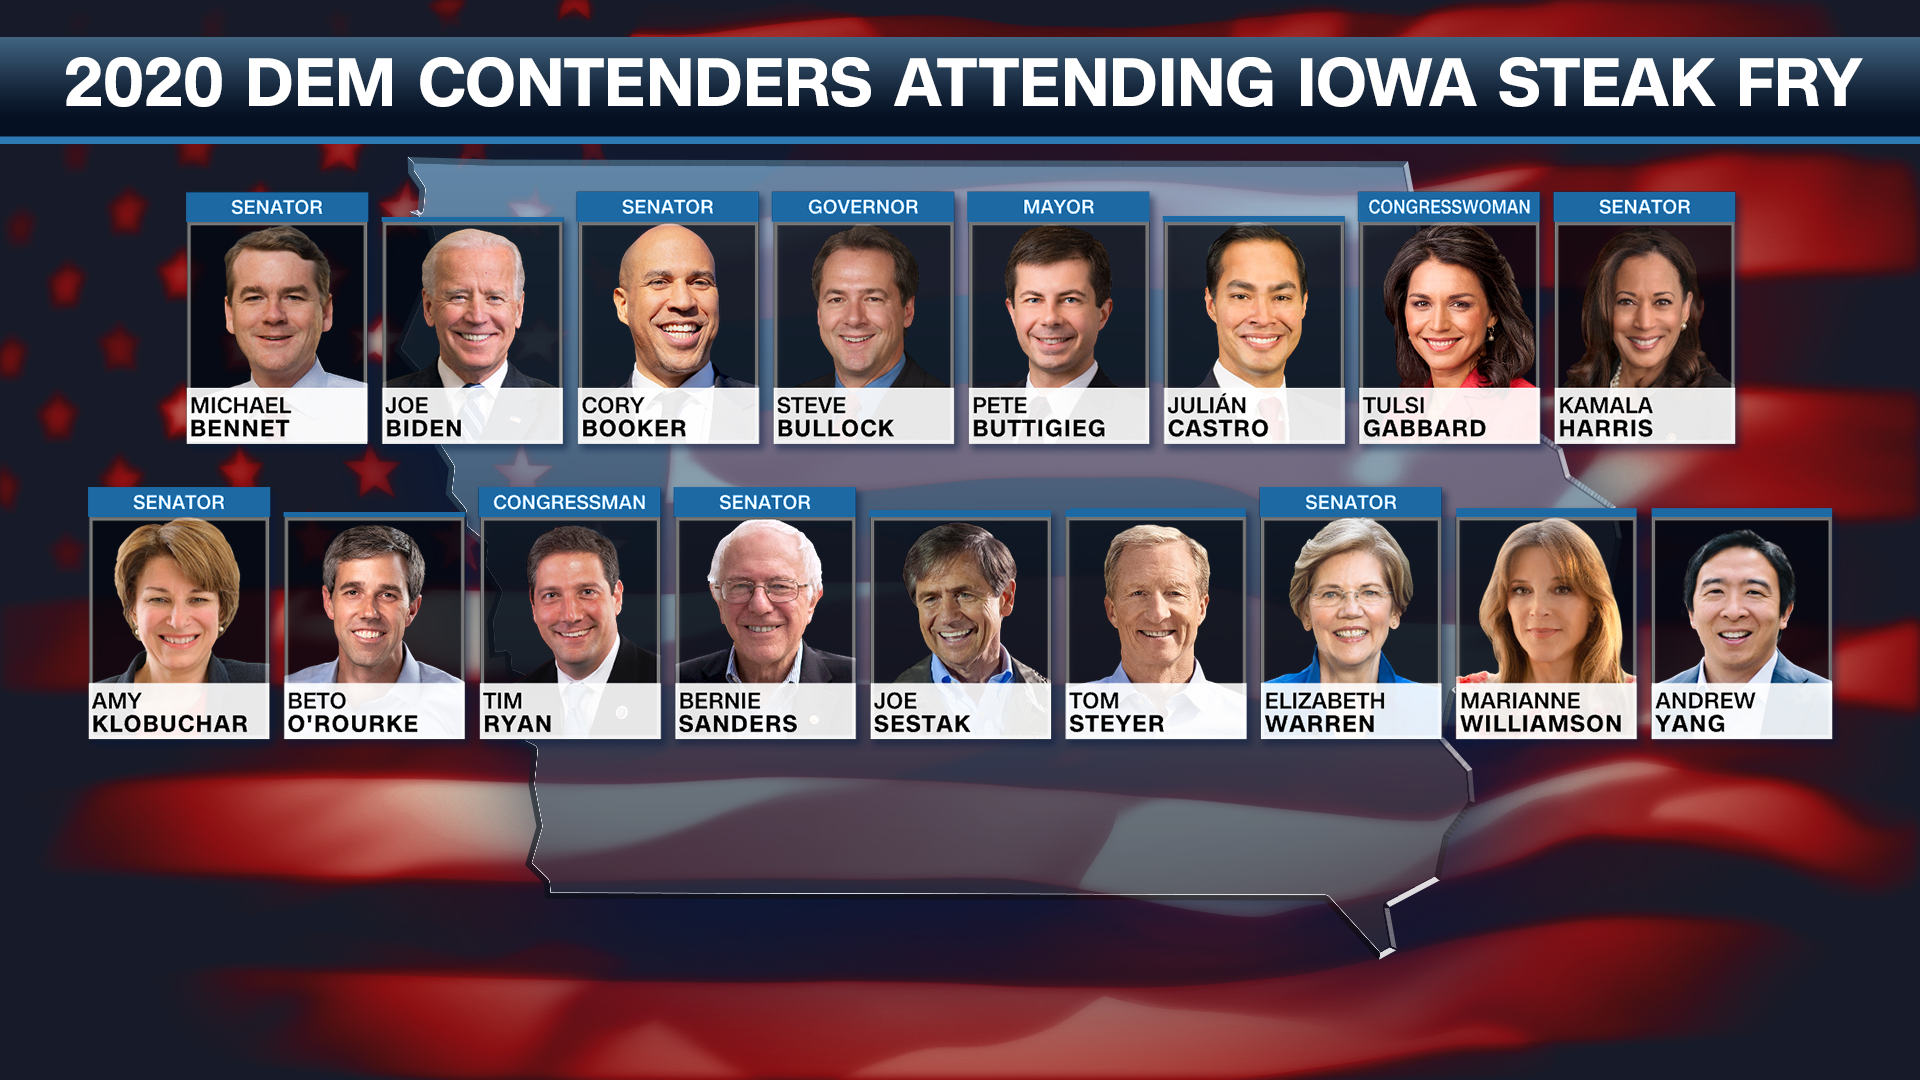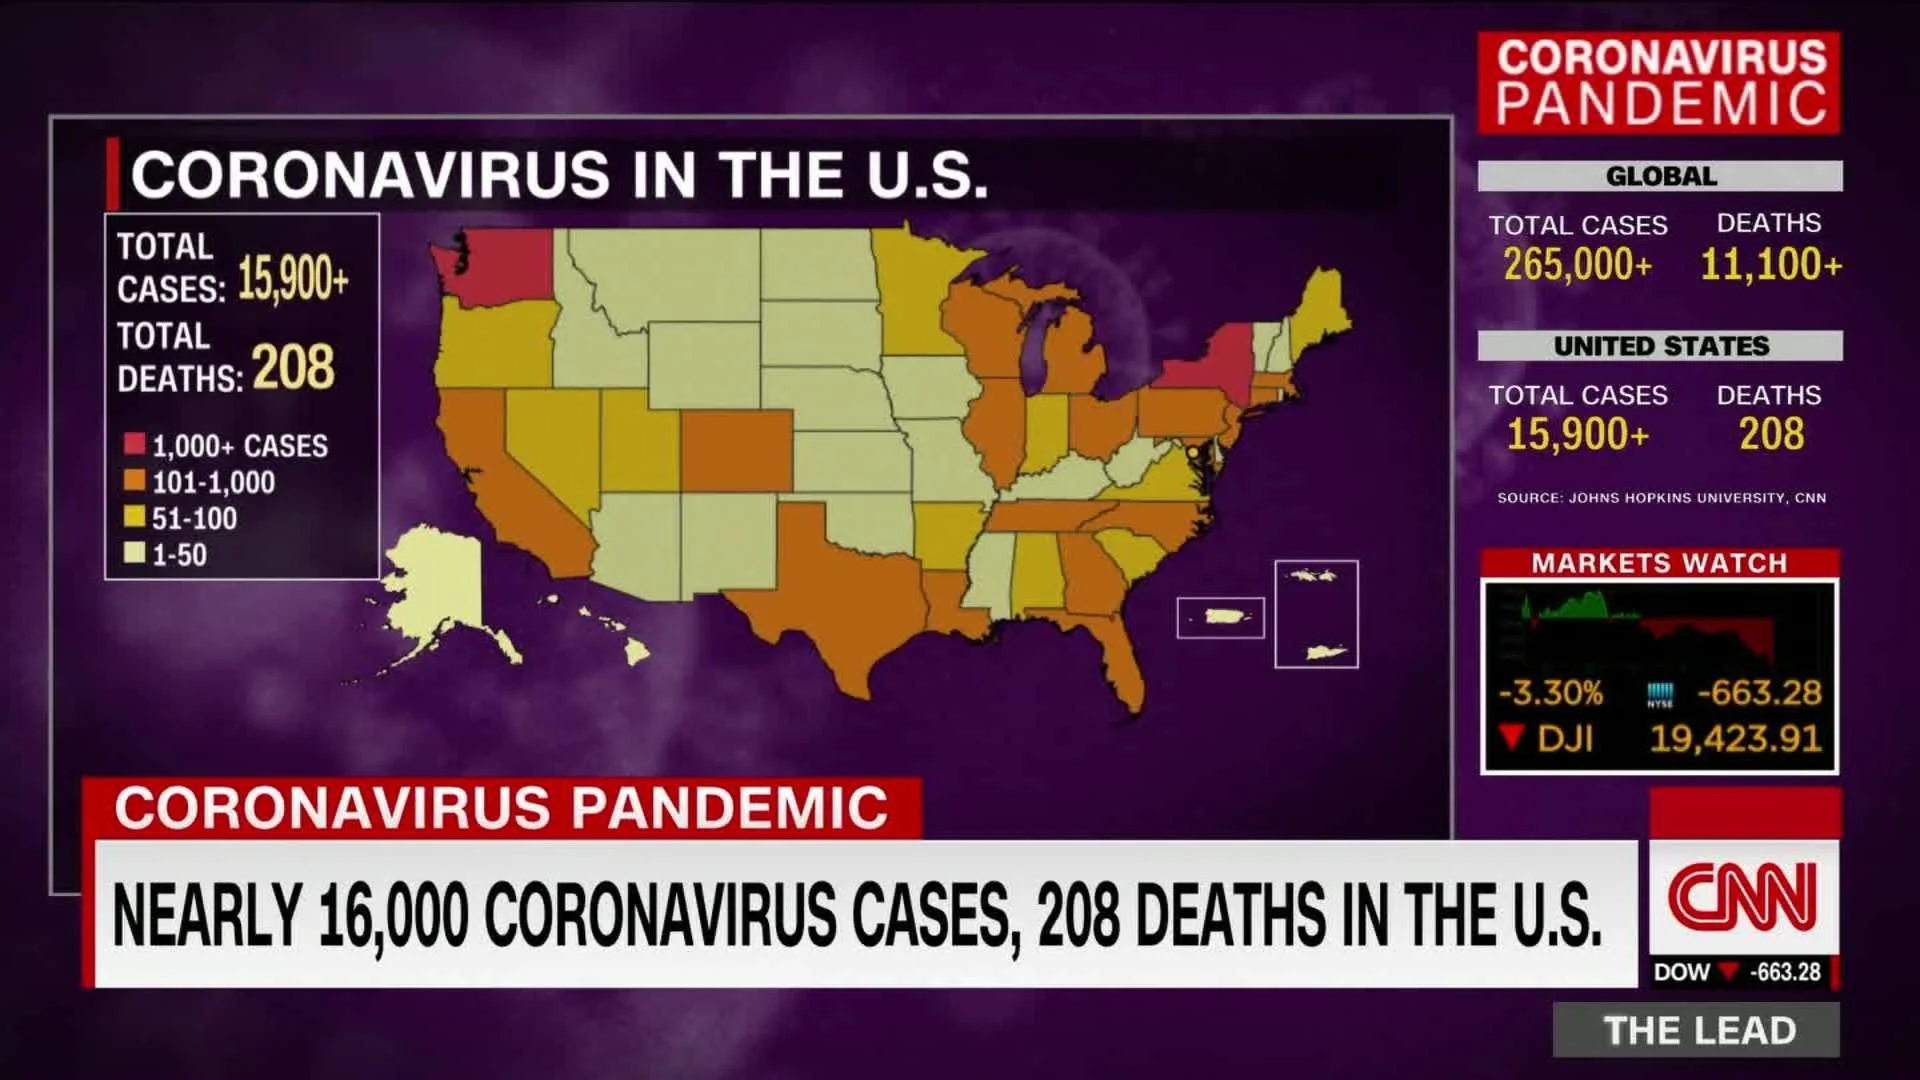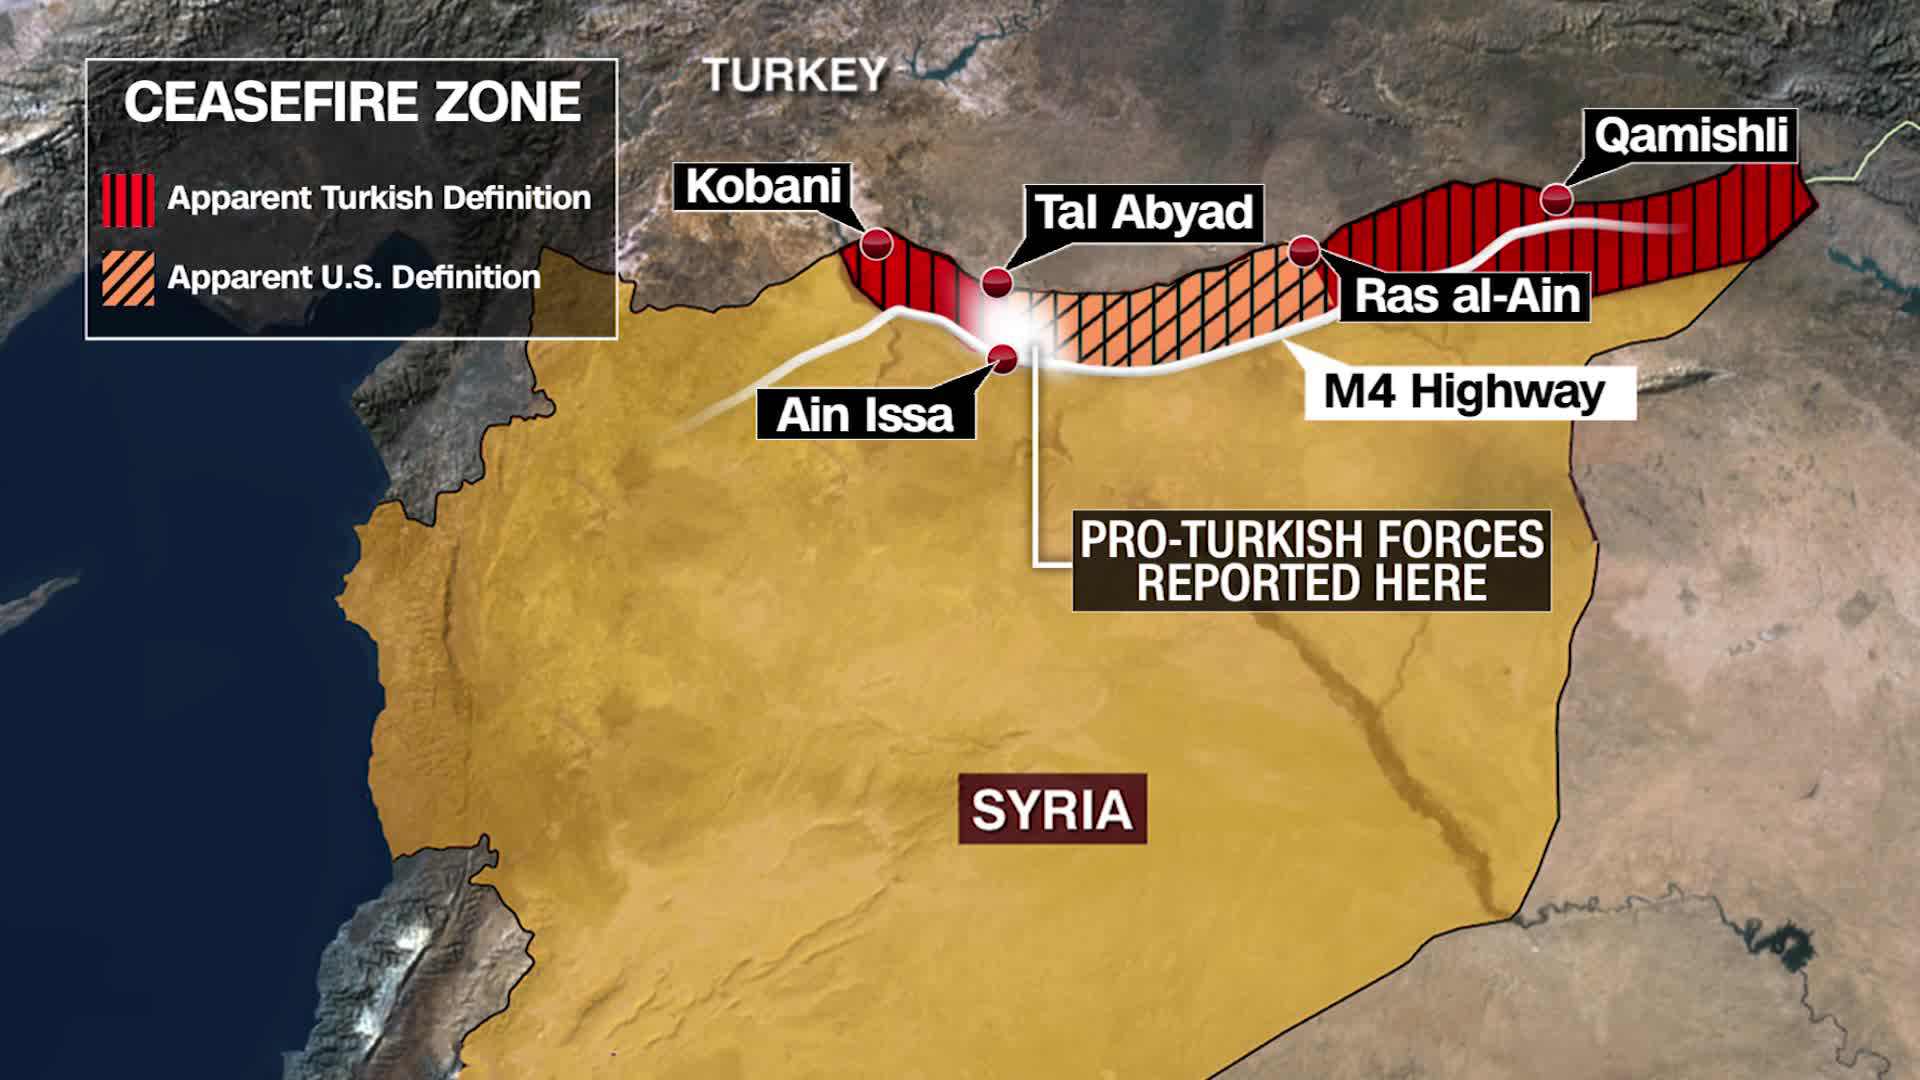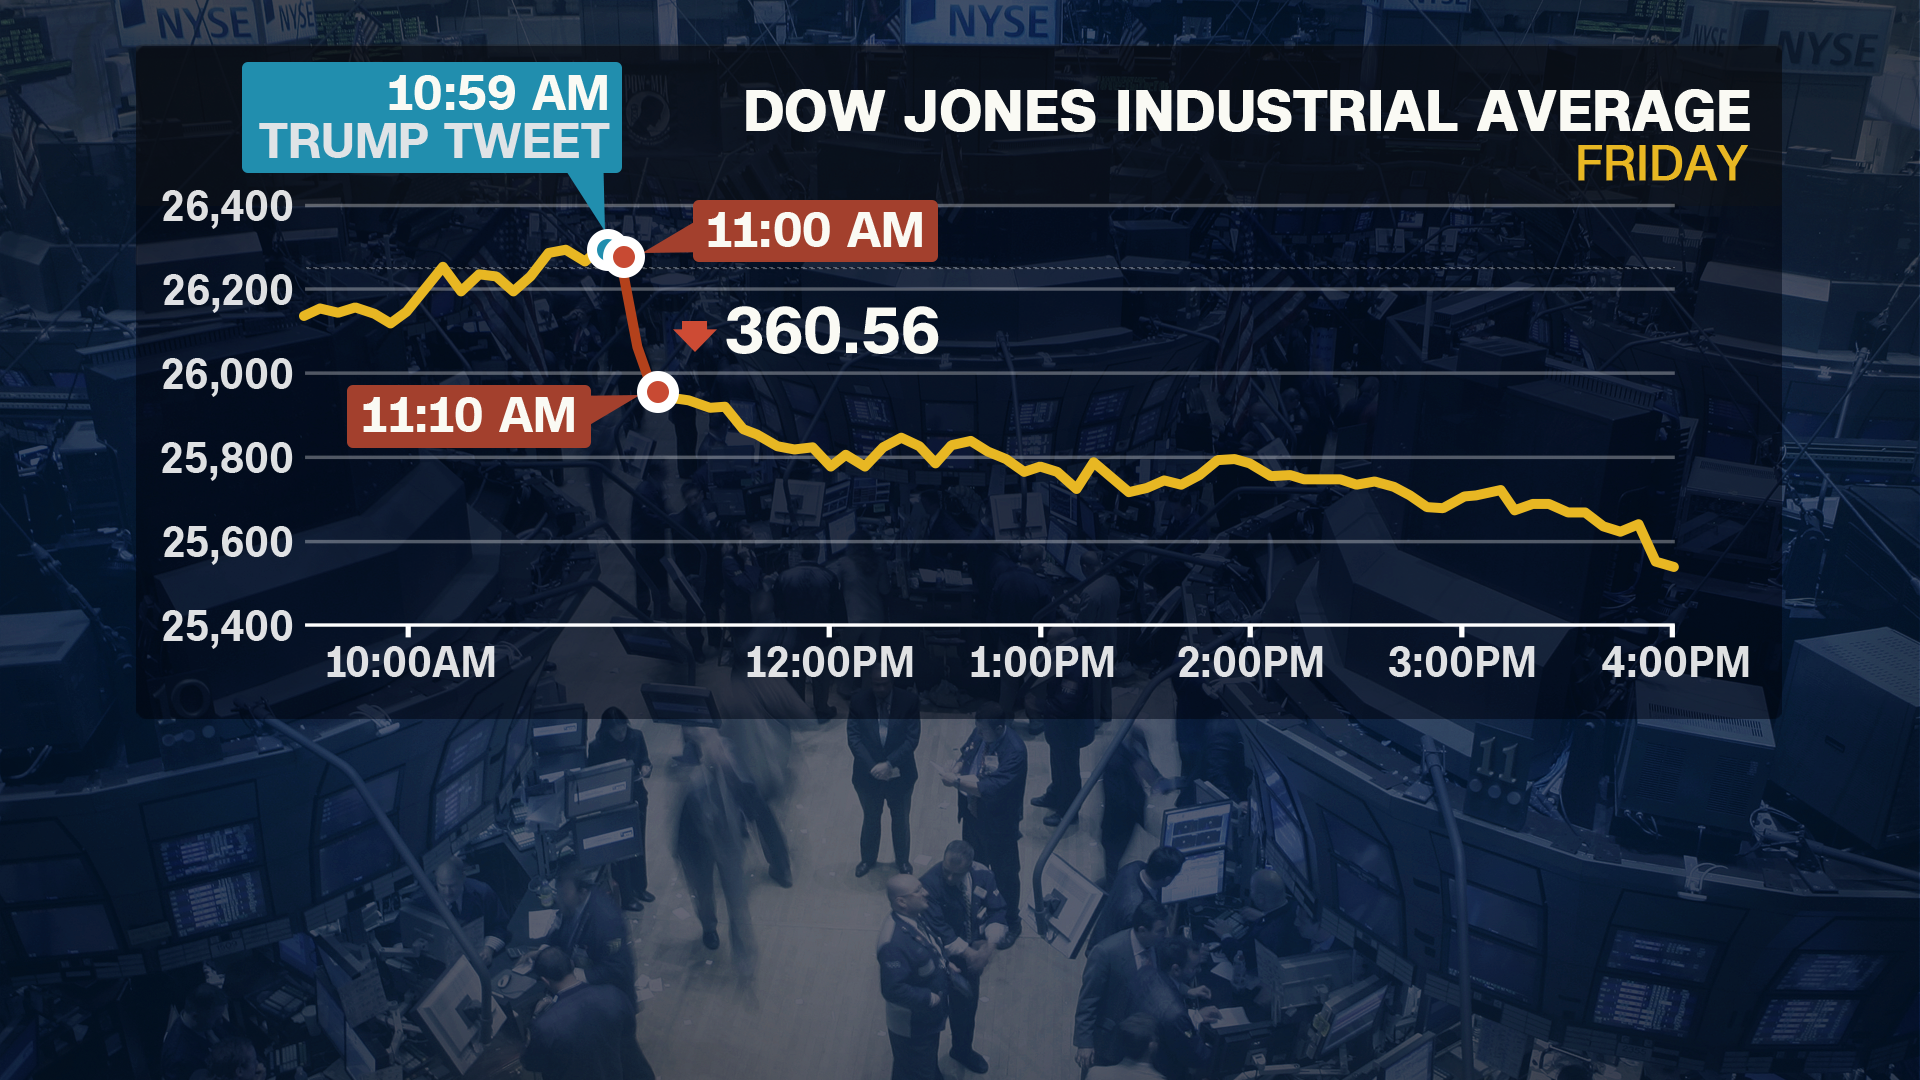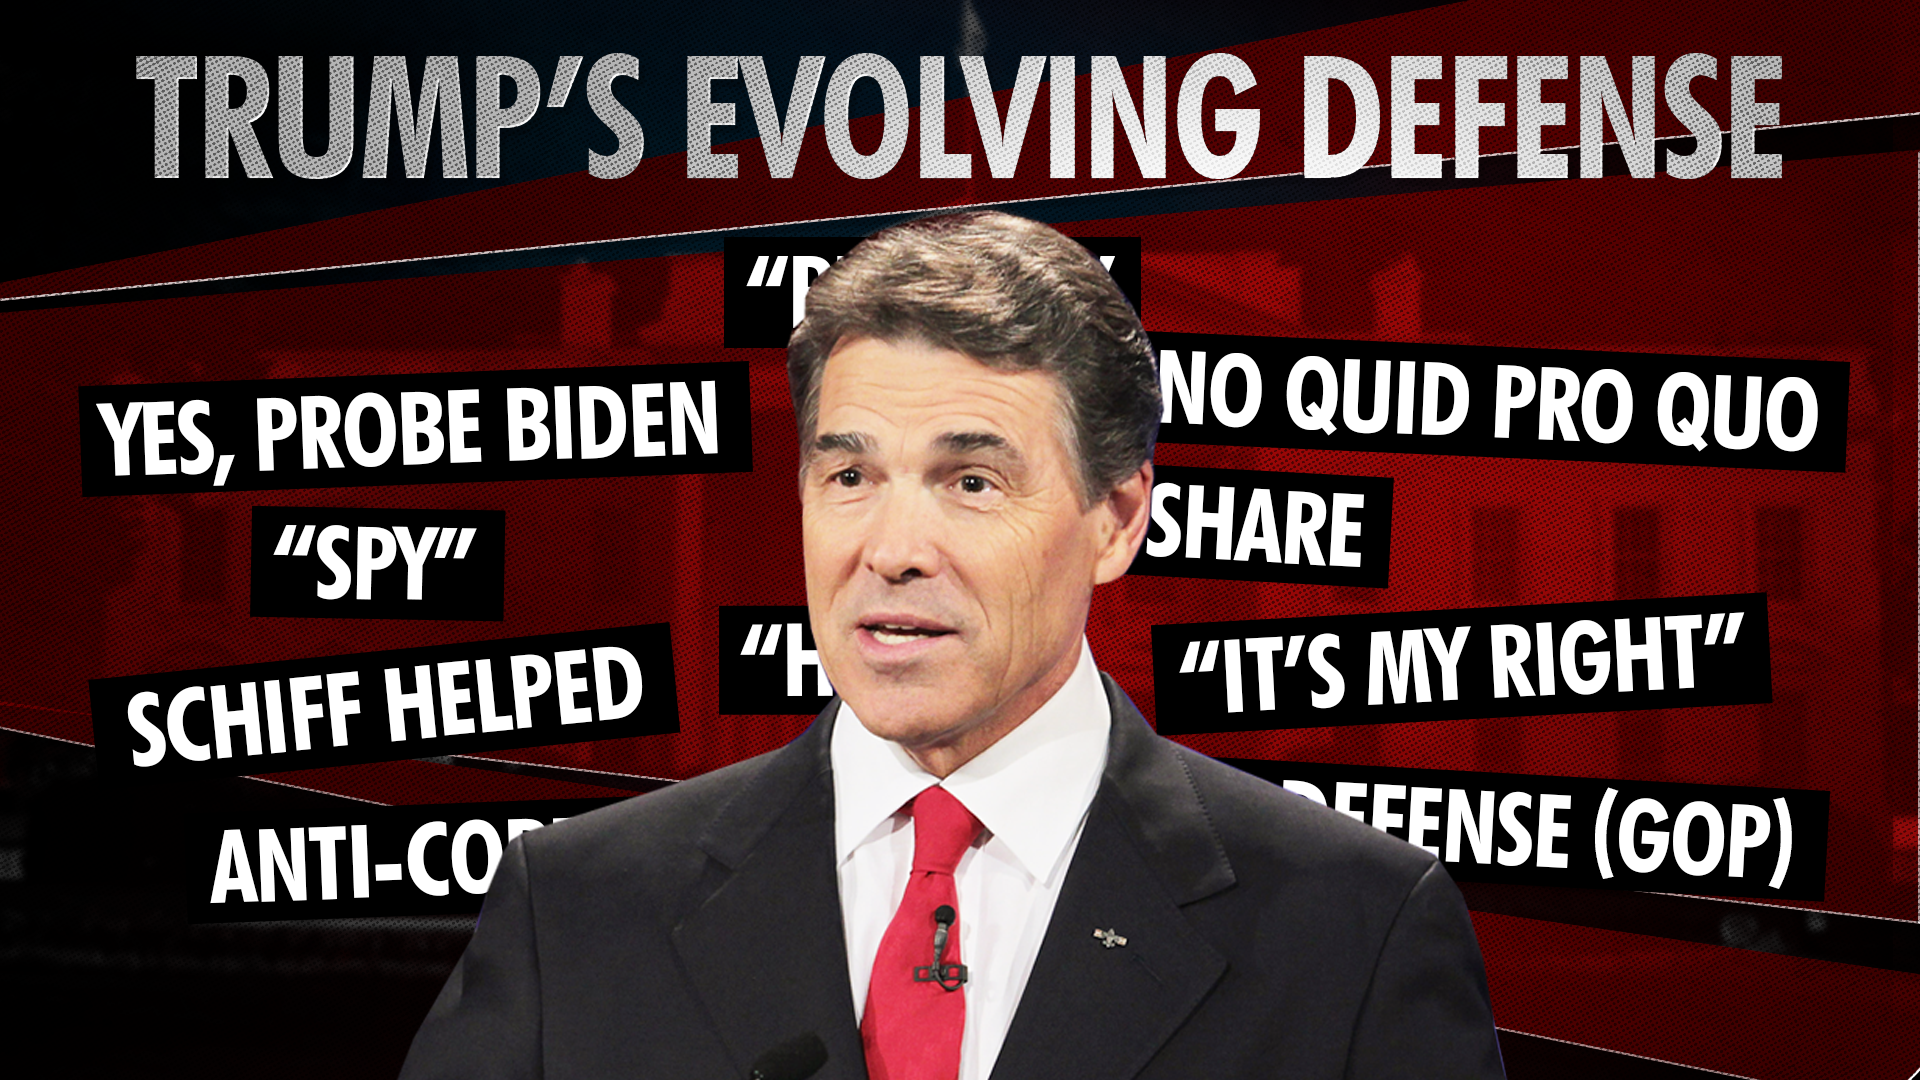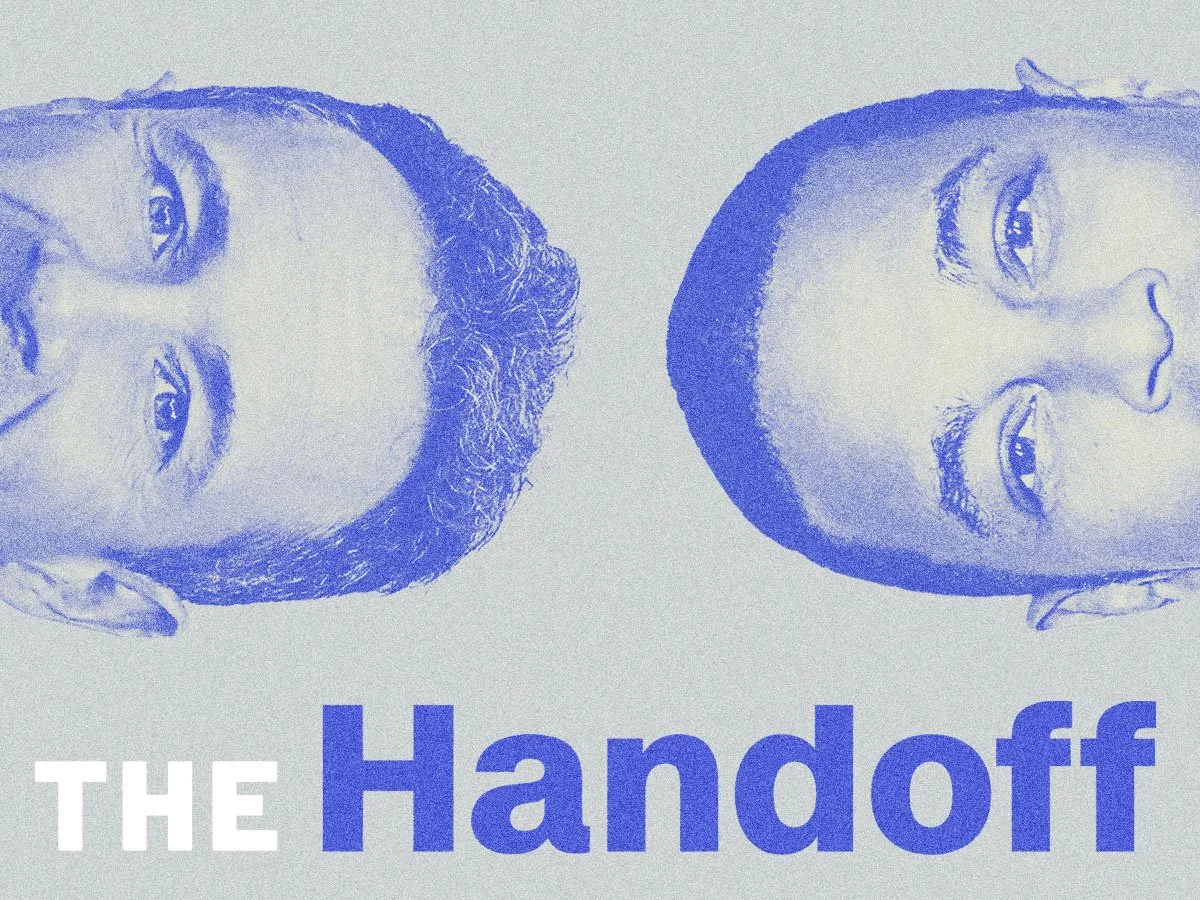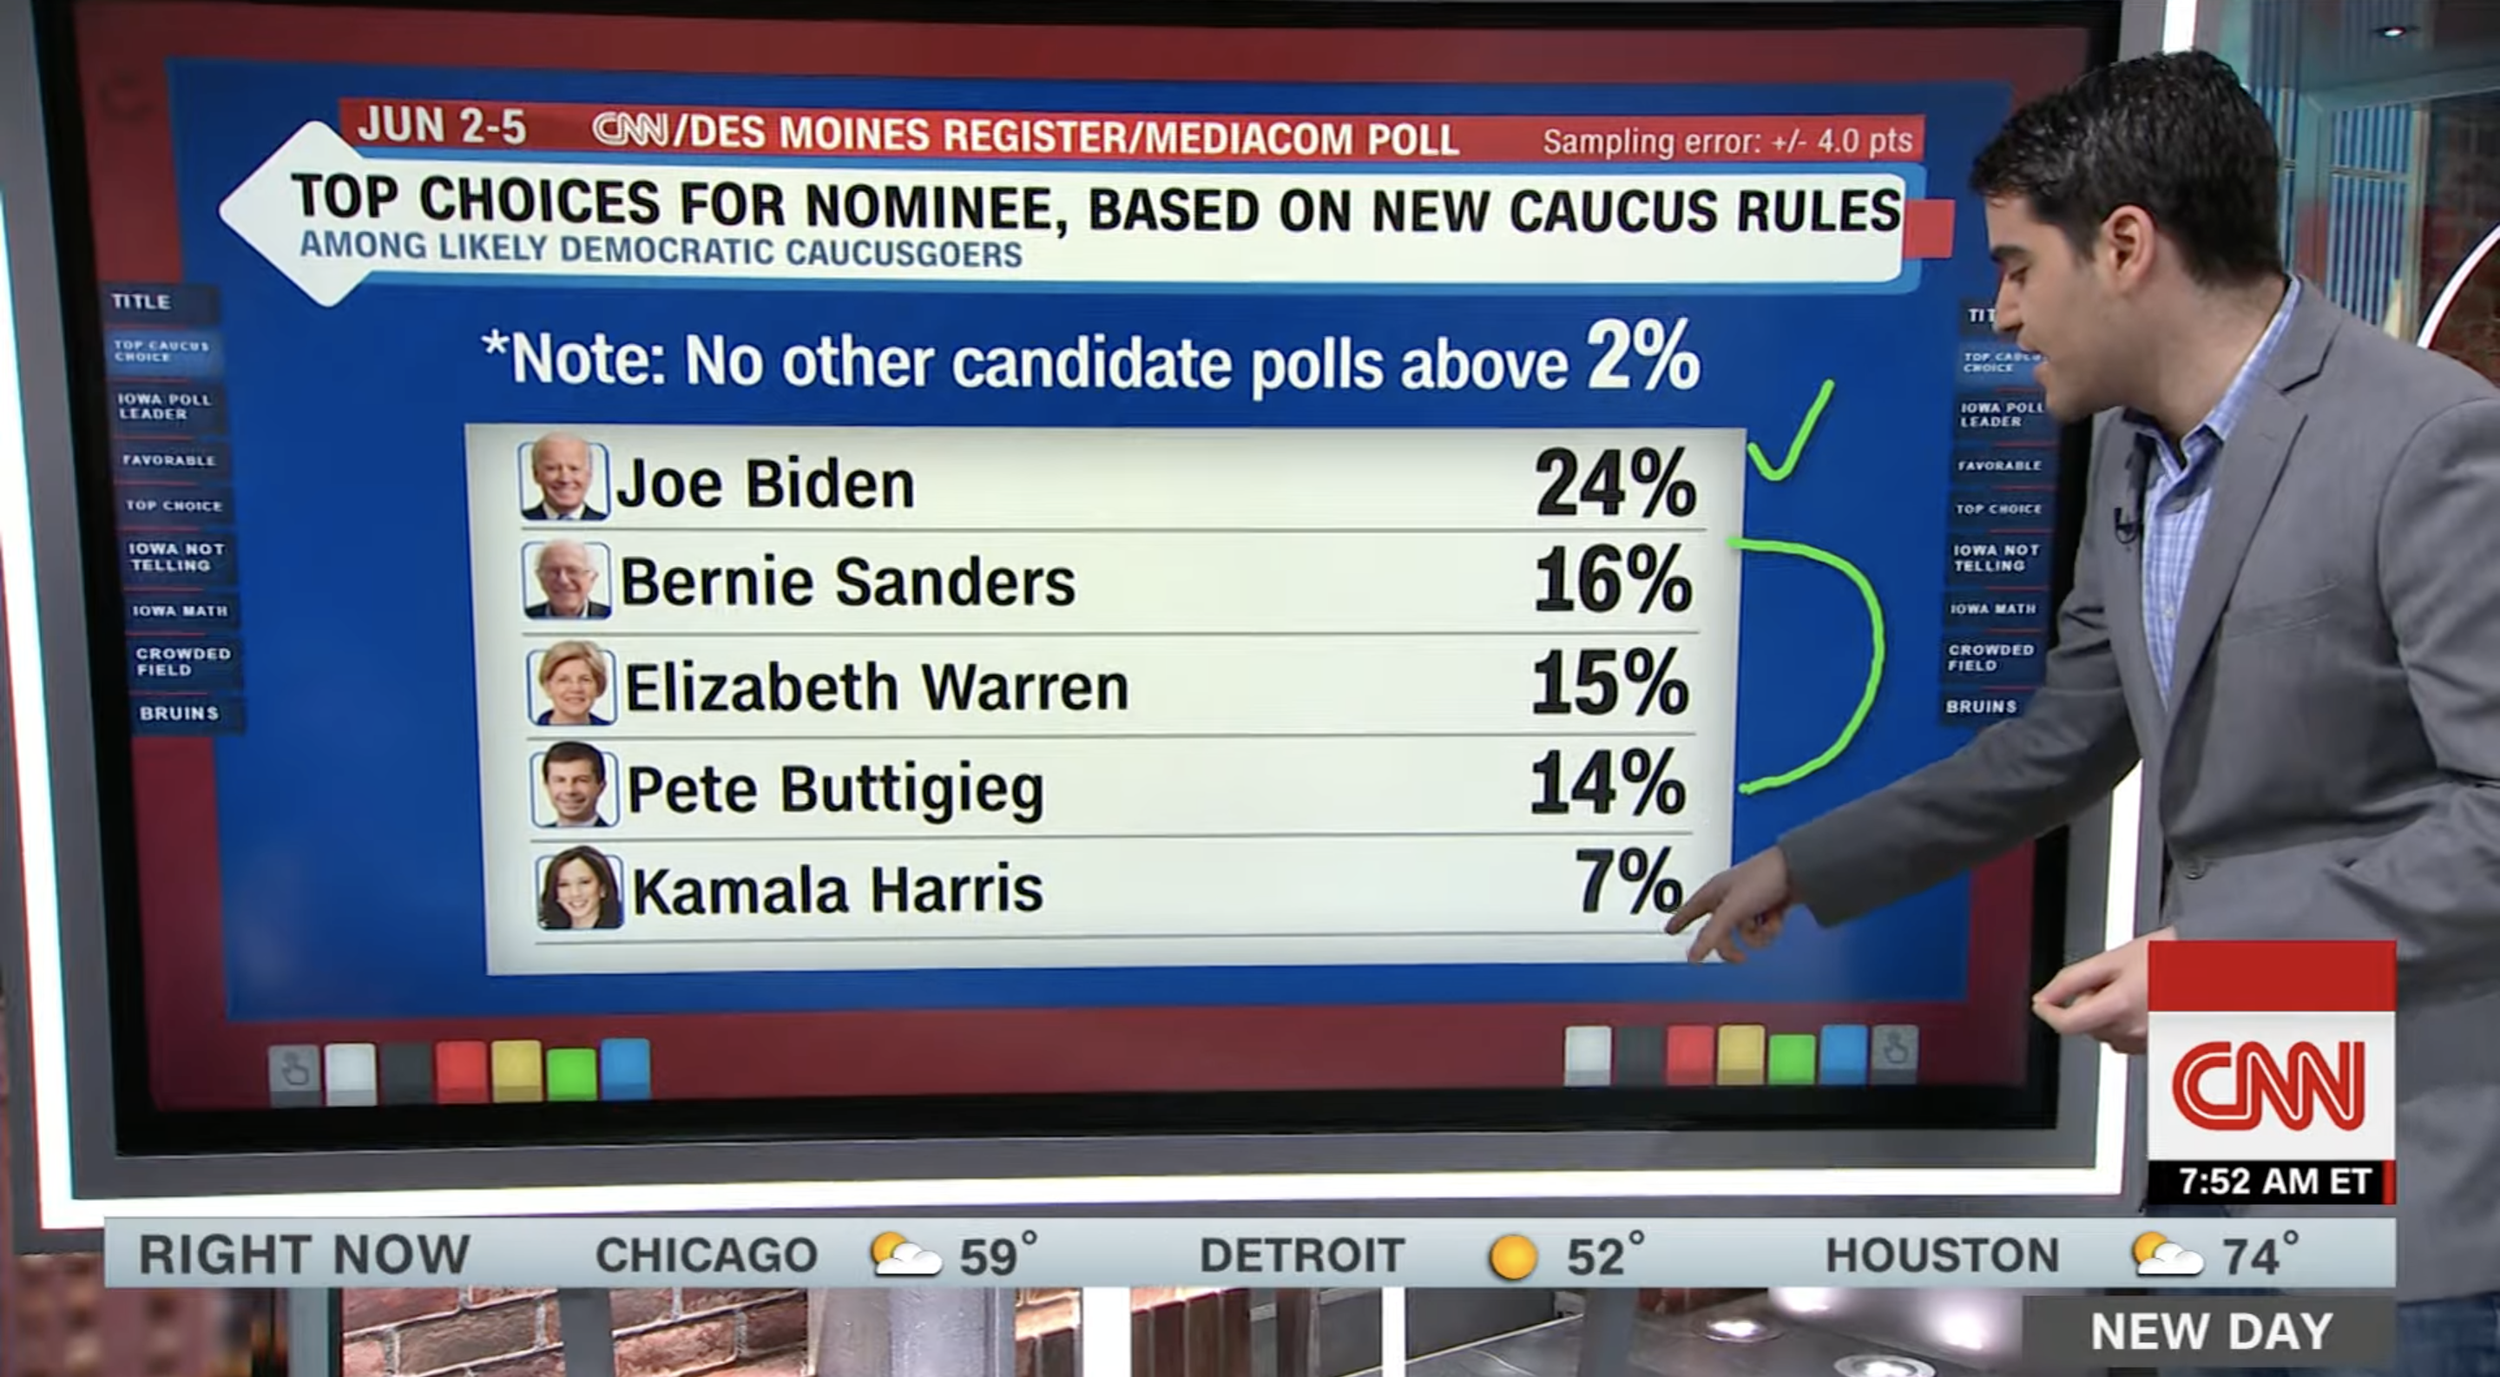
cnn broadcast design
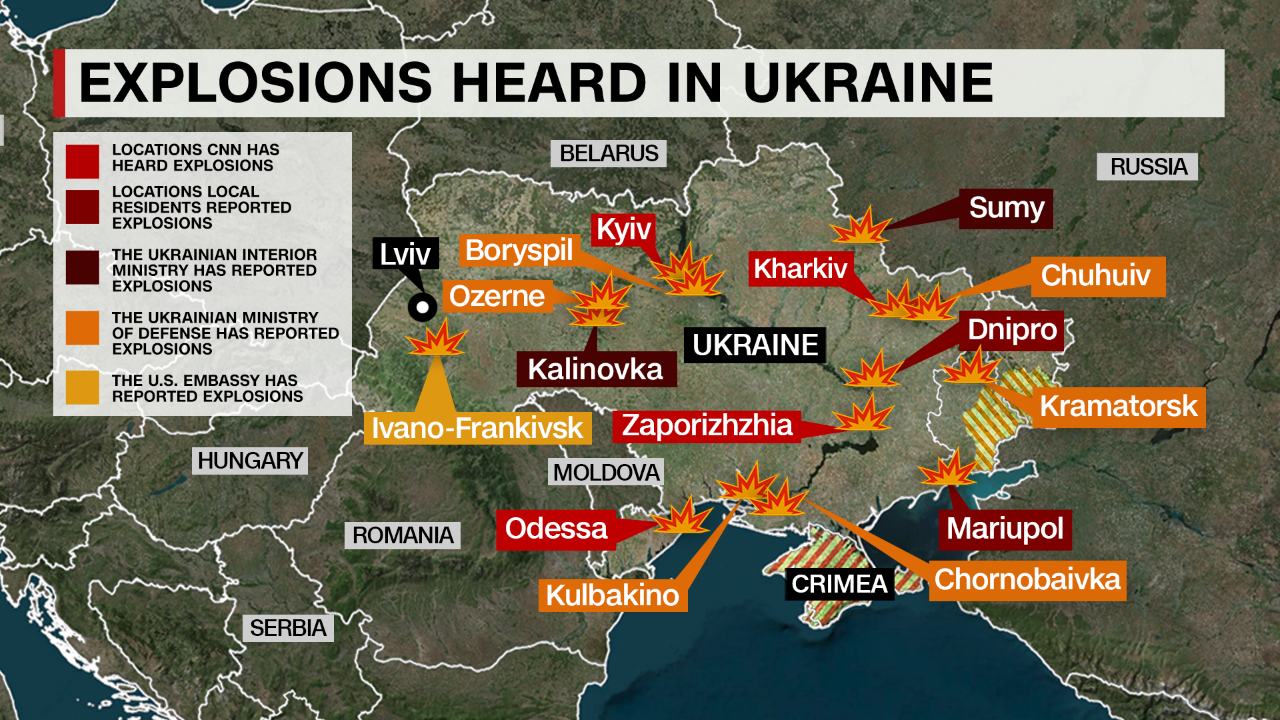
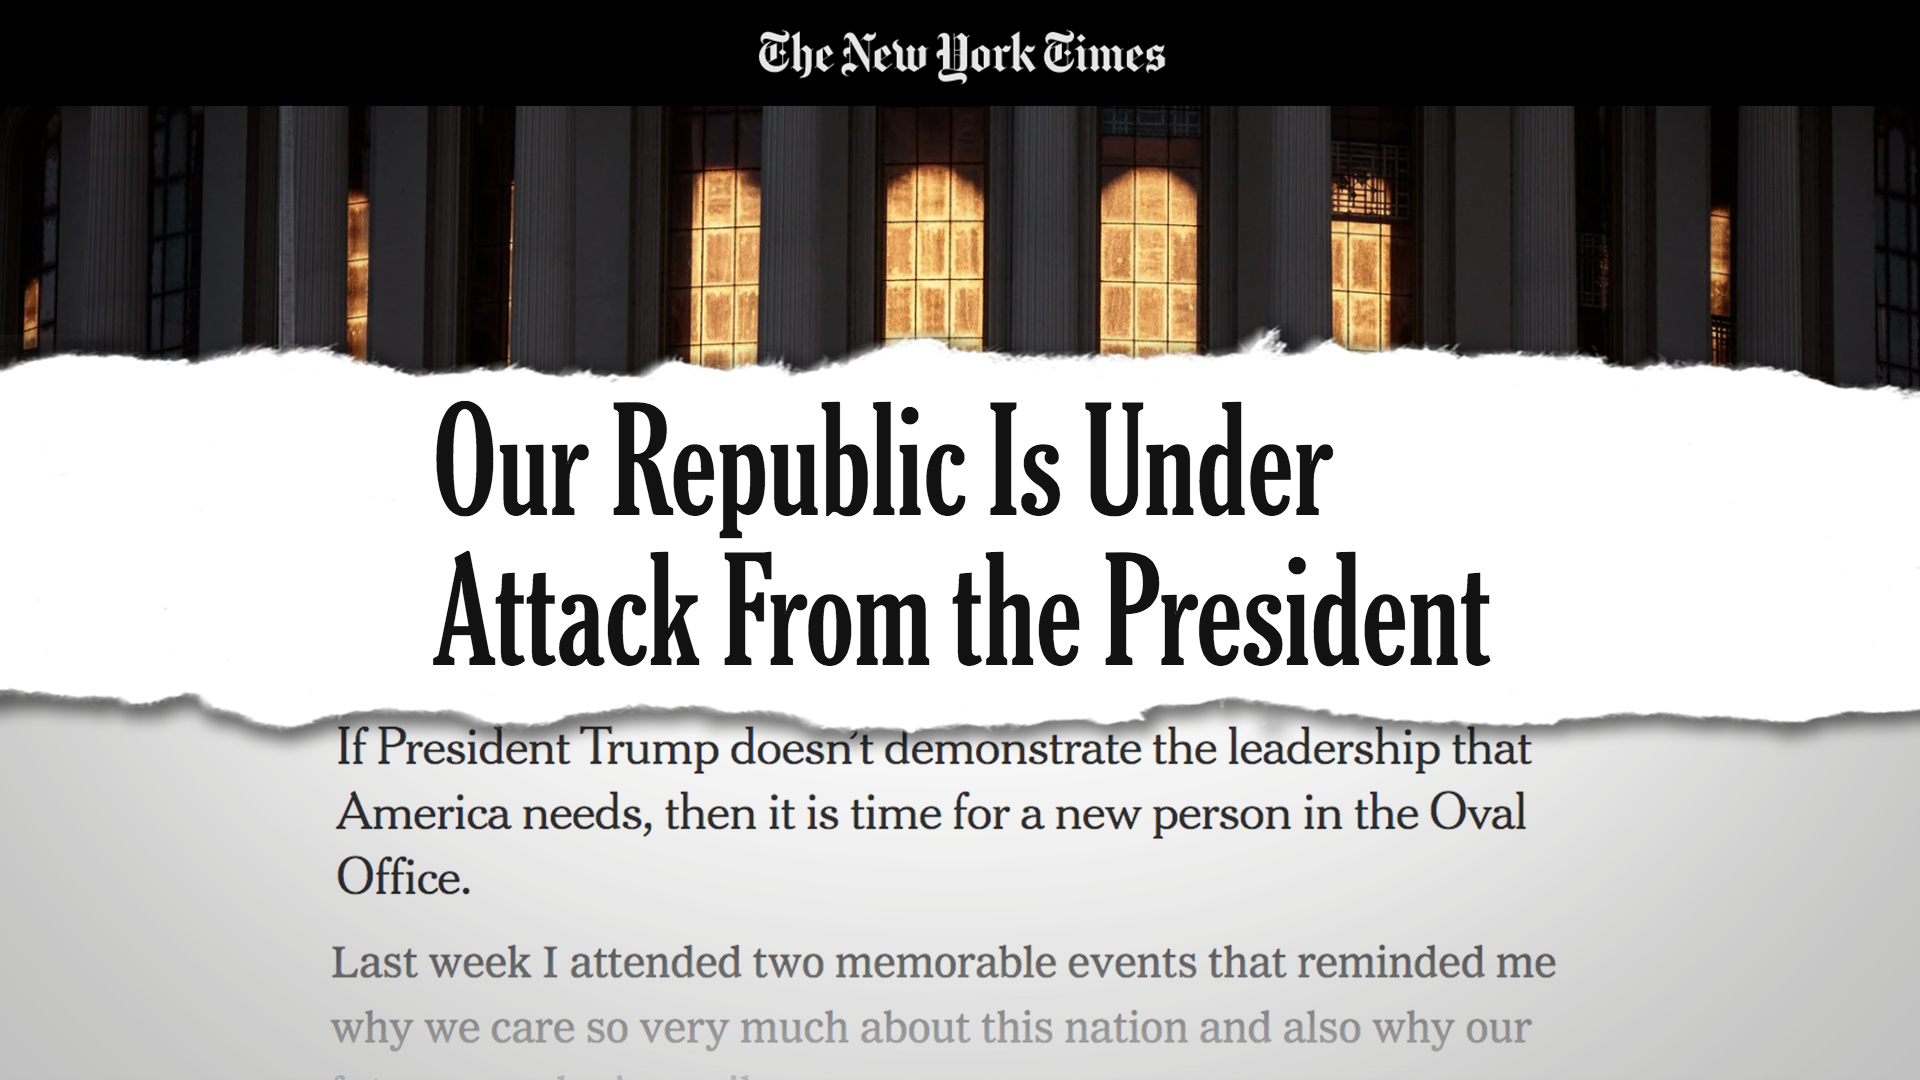
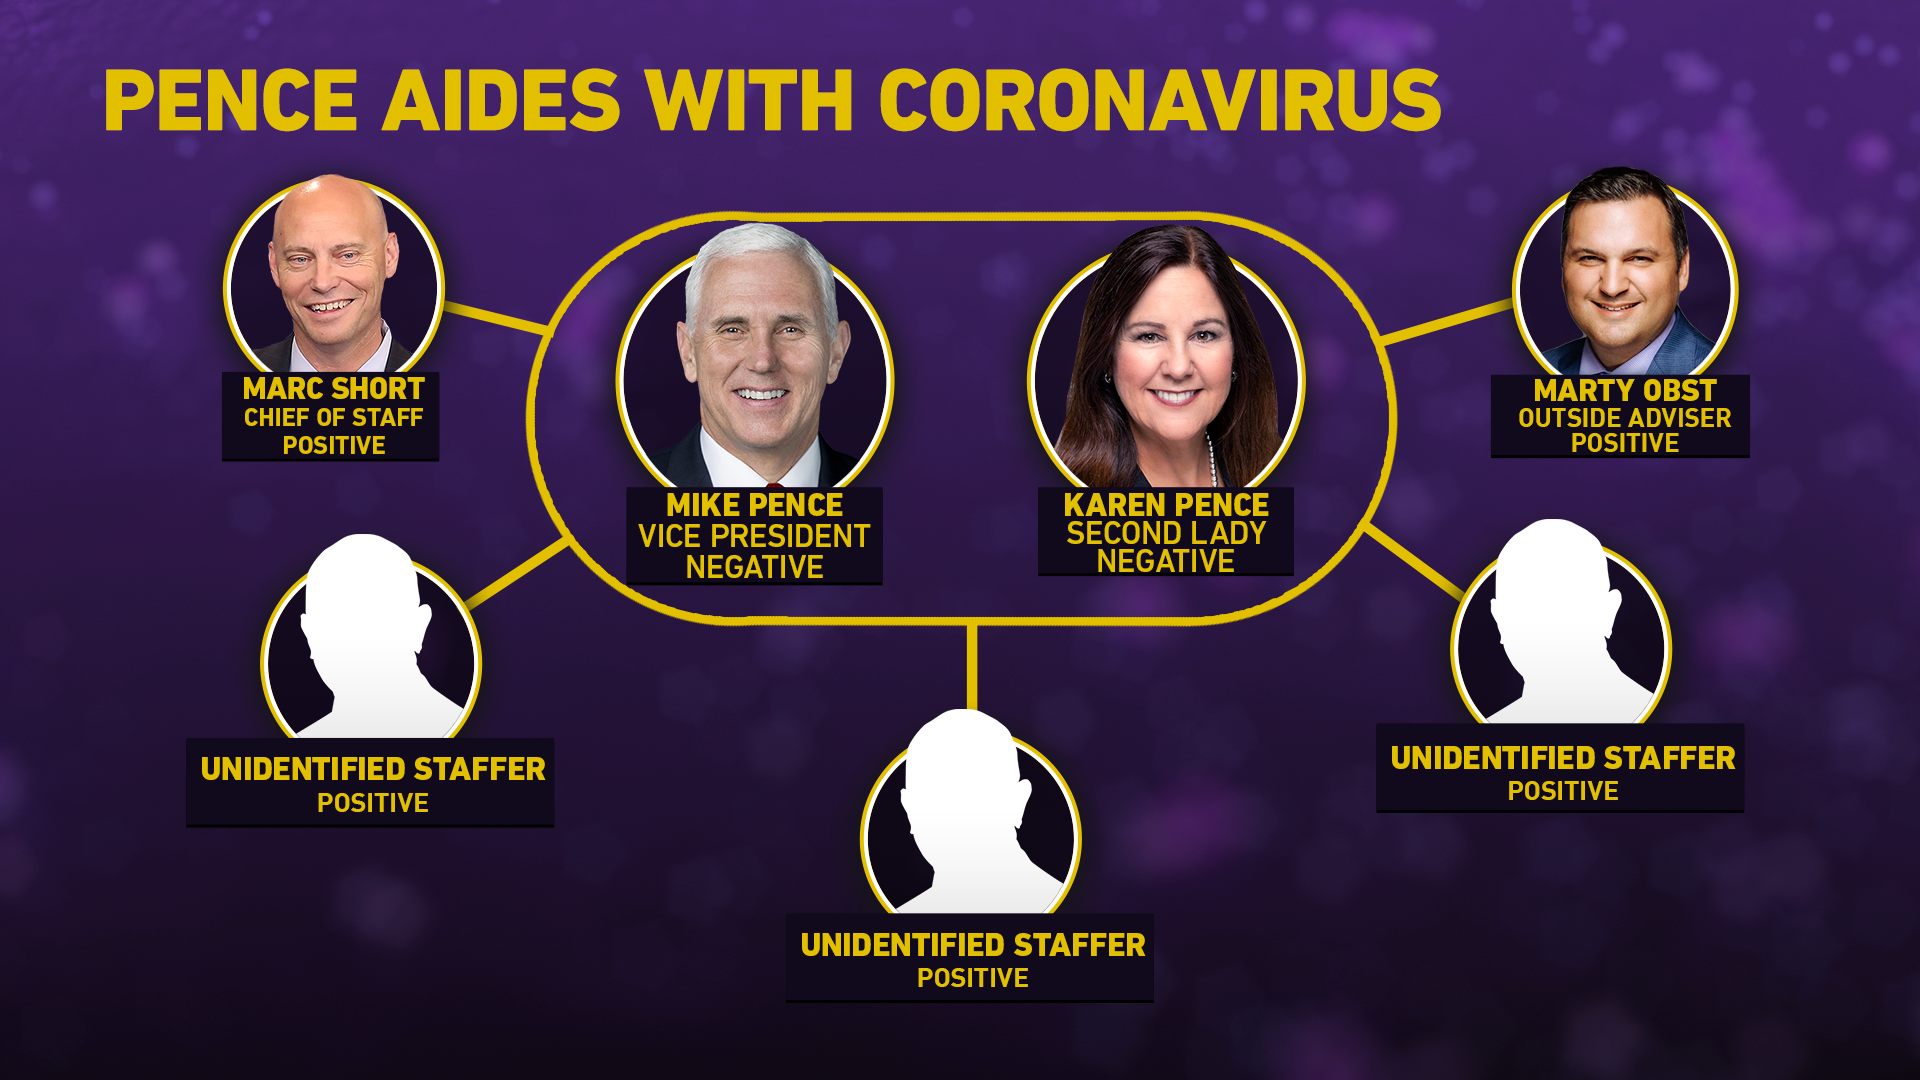
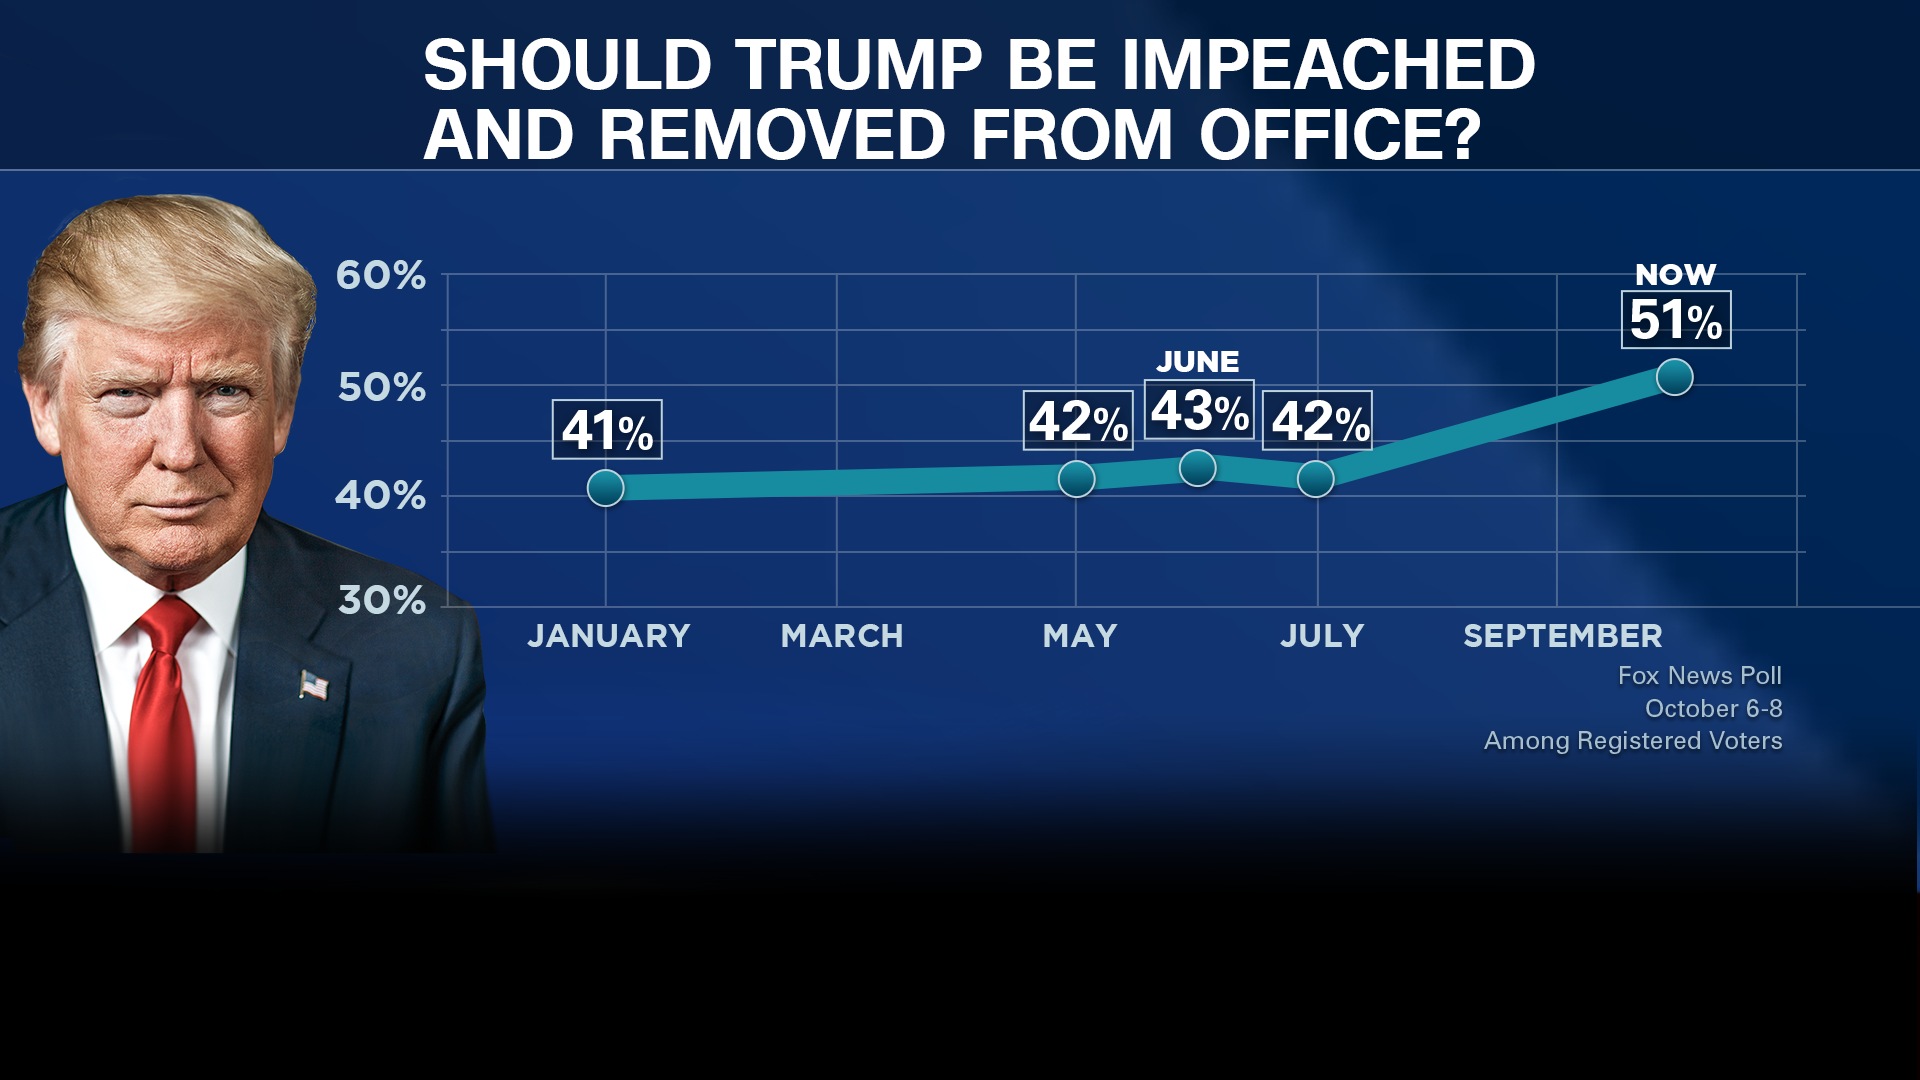
infographics, maps + charts, monfills, animated magic-wall segments, lower-thirds, etc. for CNN’s podcasts, debates, and 20 on-air shows. (what a time to be alive)
infographics, maps + charts, monfills, animated magic-wall segments, lower-thirds, etc. for CNN’s podcasts, debates, and 20 on-air shows. (what a time to be alive)